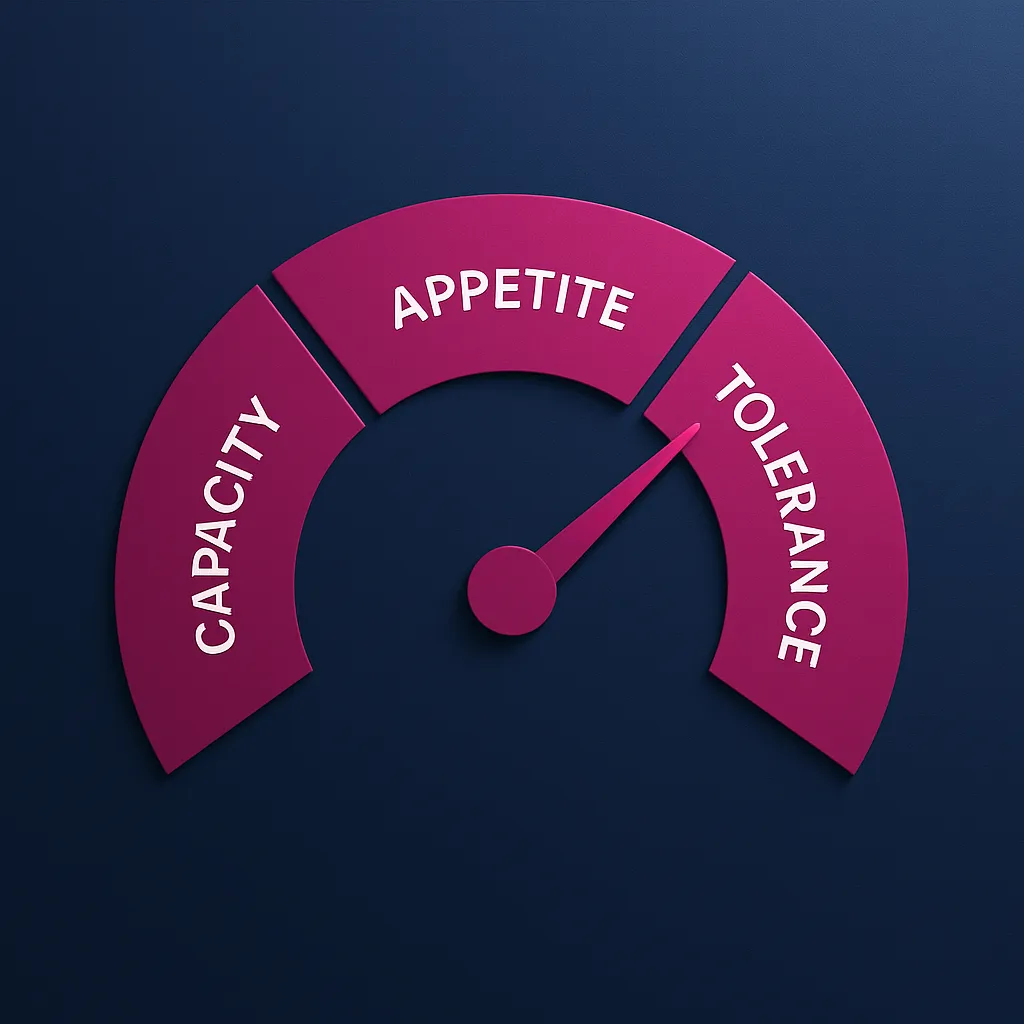
Speed & Stability: Stop Choosing, Start Winning
Black Friday 2018: Lowe’s froze every line of code “to stay safe,” yet its website still collapsed under record traffic - an expensive reminder that slowing down does not guarantee reliability.
DORA, the Research - Not the Regulation
Here DORA means DevOps Research & Assessment, the long-running Google-backed study of software-delivery performance. It is not the European banking regulation with the same acronym. Keep that distinction in mind as we explore DORA metrics.
The Four Numbers Boards Care About
- Deployment Frequency - how often production releases happen
- Lead Time for Changes - time from commit to running code
- Change Failure Rate - percentage of releases that need a rollback or hot-fix
- Mean Time to Recover (MTTR) - how quickly service is restored after failure
2024 Benchmarks - and a Plot Twist
| Performance cluster | Release cadence | Change-failure rate | MTTR |
|---|---|---|---|
| Elite | On-demand (many per day) | ≤ 5% | < 1 h |
| High | Daily → weekly | ≈ 20% | < 24 h |
| Medium | Weekly → monthly | ≈ 10% | < 24 h |
| Low | < monthly | ≤ 40% | 1 w → 1 m |
For the first time, medium performers outshine the high cluster on quality - their failure rate is roughly half - because some “high” teams sprint ahead on throughput without tightening quality gates, while many “medium” teams invest in automated tests and guarded merges before accelerating.
Speed and Safety Can Rise Together
Long-term DORA trends remain clear: elite teams deploy 182 × more often than low performers and suffer significantly fewer failures. Robust pipelines, small batch sizes, and automated safeguards - not code-freeze windows - deliver both speed and stability.
Why Medium Beats High on Quality
- Risk-weighted pipelines. Medium teams often add unit, integration, and security checks that “shift left” failures before they scale.
- Smaller release bundles. Shipping weekly keeps changes human-sized yet testable; high clusters sometimes batch daily work into riskier payloads.
- Progressive delivery. Blue-green and canary rollouts let teams validate in production without a full stop-the-world deploy.
- Quality KPIs in OKRs. Medium clusters tie MTTR and failure rates to team objectives, curbing velocity-only heroics.
- Incident retros with teeth. Each failure triggers action items that harden tests and pipelines for the next sprint.
Five Moves That Deliver Both Speed & Stability
- Automate every test that blocks release. Start with smoke and security scans.
- Adopt trunk-based development. Fewer long-lived branches mean fewer painful merges.
- Gate by risk, not committee. Replace manual CAB sign-offs with policy-as-code checks.
- Rollback first, root-cause later. Quick reversions lower MTTR and customer impact.
- Measure relentlessly. Display the four key metrics on a public dashboard every sprint.
Quick Self-Test
- Count last week’s releases.
- Recall your last incident fix-time.
- Locate your quadrant using the table above.
- Set one improvement goal: either double deployment frequency or halve MTTR next quarter.
Capture those numbers; you’ll feed them into the ROI formula later to see the dollar impact.
Turning DevOps Performance into Hard-Dollar ROI
The moment you reveal a new release cadence, your chief financial officer will ask one question: “Show me the payback.” Below is a fast, evidence-backed way to translate DevOps practices into bottom-line dollars.
Why the Question Matters
- Return on Investment (ROI) shows how many dollars you get back for every dollar you spend.
- Net Present Value (NPV) converts multi-year cash flows into today’s money, factoring in the time value of cash.
- Payback Period measures how long it takes before cumulative benefits overtake costs.
These three metrics are the lingua franca of every board packet and capital request.
The Three Buckets of Value
- Revenue Lift Faster cycle time lets you ship features sooner, capture market share earlier and trim lost-cart revenue from performance slow-downs.
- Cost Avoidance Fewer outages, rollbacks and regulatory fines mean dollars you never have to spend.
- People Productivity Automation frees engineers from manual work - hours that convert directly into new feature capacity.
Cost of Downtime
Accordoing to Pingdom’s 2023 research, below are the idustry-average (varies on the org size) cost of downtime figures:
| Industry | Cost per hour | Cost per minute |
|---|---|---|
| Media | $90,000.00 | $1,500.00 |
| Manufacturing | $260,000.00 | $4,333.33 |
| IT | $297,500.00 | $4,958.33 |
| Health care | $636,000.00 | $10,600.00 |
| Retail | $1,100,000.00 | $18,333.33 |
| TelCo | $2,000,000.00 | $33,333.33 |
| Energy | $2,480,000.00 | $41,333.33 |
| Automotive | $3,000,000.00 | $50,000.00 |
| Brokerage | $6,480,000.00 | $108,000.00 |
| Average | $1,815,944.44 | $30,265.74 |
| Median | $1,100,000.00 | $18,333.33 |
Proof in the Wild
(Forrester TEI, 2024)
- GitLab Ultimate
- 483% ROI over 3 years
- $74.6 M NPV
- Payback < 6 months
- Headline benefit: 535 engineer hours saved per developer each year, plus $37.7 M in faster time-to-market gains.
- CloudBees Platform
- 426% ROI over 3 years
- $30.9 M NPV
- Modeled payback ≈ 5 months
- Stand-out win: 99% reduction in developer hours lost to outages, worth $10.6 M in productivity alone.
- Atlassian Open DevOps
- 237% ROI over 3 years
- Payback 19 months
- Value split: 55% productivity, 30% cost avoidance, 15% incremental revenue.
Across three independent studies the pattern is consistent: tooling + process automation pays back in well under two years, often inside one fiscal half.
The CFO-Friendly Formula
ROI (%) = [ (Δ Downtime Cost + Δ Productivity Value + Δ Revenue) – Investment ] ÷ Investment × 100
- Δ Downtime Cost = minutes avoided × $18 333 (median cost per outage minute)
- Δ Productivity Value = engineer hours saved × loaded hourly rate
- Δ Revenue = annual revenue × expected uplift (start with 5%)
- Investment = licenses, cloud spend, training, and internal labour
7-Minute ROI Worksheet & Worked Example
- Gather three numbers
- Outage minutes last year
- Engineer head-count
- Annual revenue
- Select conservative assumptions
- 50% downtime cut
- 100 hours saved per engineer
- 5% revenue uplift
- Run the math
| Item | Example value | Calculation | Result |
|---|---|---|---|
| Outage savings | 600 min avoided | 600 × $18 333 | $11 M |
| Productivity | 100 h/eng | 200 eng × 100 h × $75/h | $1.50 M |
| Revenue lift | 5% | $120 M × 5% | $6.00 M |
| Total benefit (Year 1) | - | - | $18.5 M |
| Investment | Tooling + training | - | $3.2 M |
| ROI | - | (18.5 – 3.2) ÷ 3.2 | 478% |
| Payback | - | 3.2 ÷ (18.5 / 12) | < 5 months |
- Stress-test the result. Halve every benefit and the ROI still clears 150%.
- Add a sensitivity row for regulatory fines avoided to show upside not yet counted.
Seven minutes of arithmetic gives you a board-ready answer to “Where’s the payback?” - and proof that the investment is smaller than the risk of waiting.
Three-Minute Board Memo
Subject: Reducing regulatory, security and outage risk via DevOps controls
Ask: Invest $3.2 M in pipeline automation and SRE tooling
Benefit:
- Cuts average outage cost by 50% (≈ $7 M/year)
- Eliminates manual evidence gathering for SOX/GDPR audits
- Frees 10 000 engineer hours for new features
Payback: < 6 months
Copy, adjust the numbers to your environment, and attach it to your next risk-committee deck - three minutes, tops.
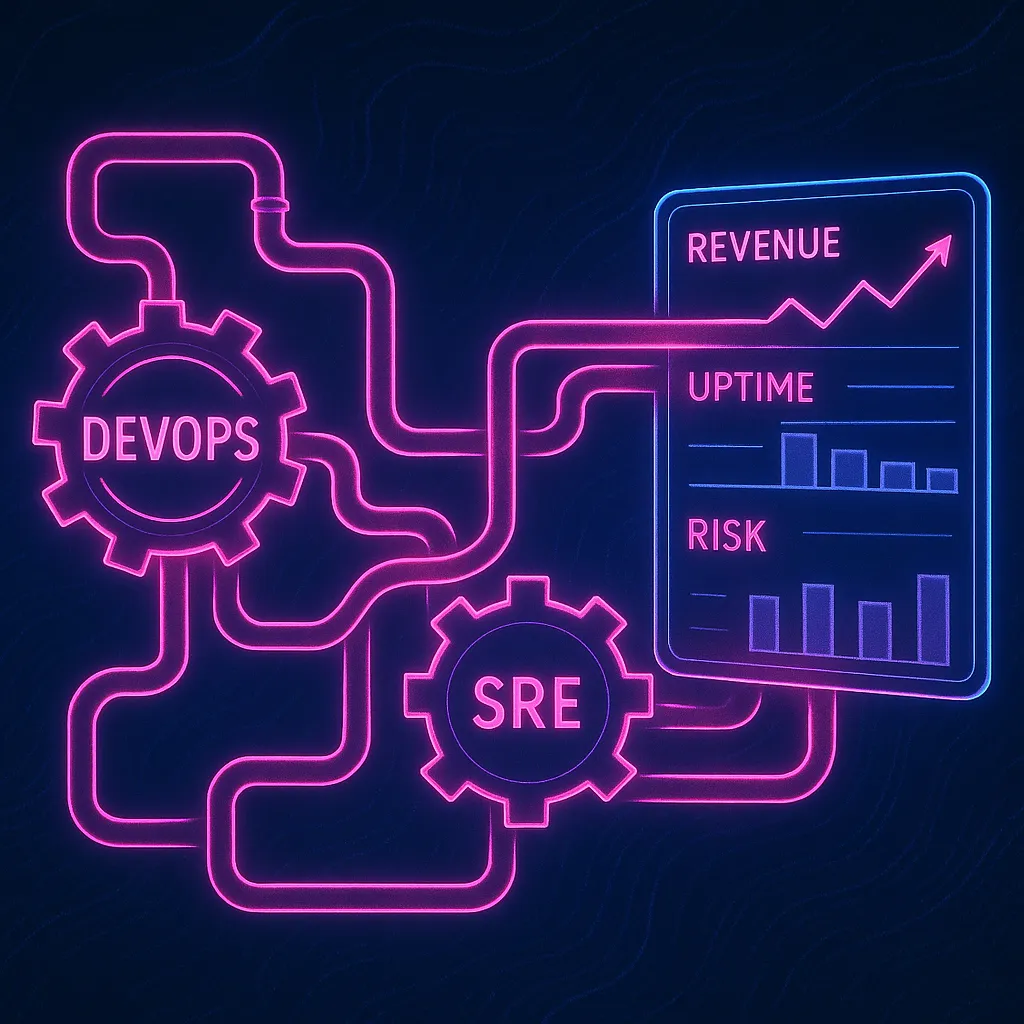
Shielding the Business: DevOps as a Risk-Reduction Engine
In May 2025, TikTok was hit with a $575 million GDPR penalty for letting China-based engineers access European user data - an incident born not of hackers but of deployment-pipeline gaps and weak access controls. The message to boards is blunt: technology risk has grown too large for quarterly change committees and manual sign-offs. DevOps practices - when coupled with Site Reliability Engineering (SRE) discipline - shrink that exposure faster and more predictably than any checklist audit.
Why Classic Controls Fall Short
Traditional change-approval boards focus on pre-deployment paperwork; real danger now lurks after software ships:
- Shadow infrastructure. Untracked cloud resources escape manual inventories.
- Post-merge drift. Hot fixes diverge from source control, creating blind spots.
- Slow rollbacks. The longer a bad change lives, the bigger the blast radius.
How DevOps Shrinks the Blast Radius
| Risk Category | DevOps/SRE Control | Outcome |
|---|---|---|
| Security & Privacy | Infrastructure as Code (IaC) locks every resource in version control; static-analysis gates block secrets before merge. | Unauthorised access paths close before deployment. |
| Compliance & Audit | Policy-as-Code embeds SOX/GDPR controls in the pipeline; every build produces an immutable evidence artefact. | Auditors see real-time proof, not after-the-fact spreadsheets. |
| Availability | Error budgets (SRE) cap the allowable outage minutes; progressive delivery (canary, blue-green) lets you roll back in <60 seconds. | Service impact stays below seven-figure thresholds. |
Error budget is the maximum downtime an SLO allows in a period; crossing it pauses new releases until reliability recovers.
Takeaway
DevOps is not just a faster release train; it is an automated safety net that keeps fines, front-page outages and late-night firefights off the balance sheet. In the final unit, we’ll turn these insights into a one-slide narrative that wins board approval.
Bringing It All Together
Elite DevOps teams prove that releasing fast and running safe are not opposites - they are two sides of the same disciplined practice. The evidence is hard to ignore:
- Speed with quality: On-demand deployments and < 1-hour recovery times are achievable when automation replaces manual gates.
- Dollars on the table: Independent studies show returns above 400% and payback in a few months, driven by lower outage costs, higher engineer productivity, and earlier revenue capture.
- Risk under control: Policy-as-code, progressive delivery, and SRE error budgets cut the blast radius of change and keep seven-figure fines at bay.
If you track only one metric this quarter, choose Mean Time to Recover: it touches customer trust, regulatory exposure, and engineering focus in a single number.
Ready to see what these gains look like in your own ledger? Drop last year’s outage minutes, head-count, and revenue into the ROI calculator above. In about five minutes you’ll have a board-ready business case - and a clear next move toward elite performance.