Technical teams speak in errors, latency, and uptime. Business leaders speak in revenue, risk, and customer trust. In many organizations, those languages never meet. Dashboards glow green while orders fall. Support hears complaints while monitoring says all clear. Finance closes the day before anyone can say how big the hit was.
The Answer Monitoring Dashboards Often Miss
Ops says everything is green. Customers report payment timeouts. Finance sees fewer orders. The room goes quiet because no one can answer the only question that matters to a leader - are we making or losing money right now because of a technology issue?
Most dashboards describe what systems are doing but fail to show what it means for revenue, risk, or customer trust. The result is noise when you need signal. What works better is a simple way to move from low-level alerts to business impact in a few clear steps that everyone can follow.
Why dashboards miss the question
Traditional views stack dozens of charts with no hierarchy. Teams end up debating which metric matters instead of deciding what to do. Tool boundaries create blind spots - your stack looks fine while a third-party provider slows checkout. Business impact shows up late because people wait on end-of-day reports. You need a way to shorten the path from alert to meaning so action happens sooner.
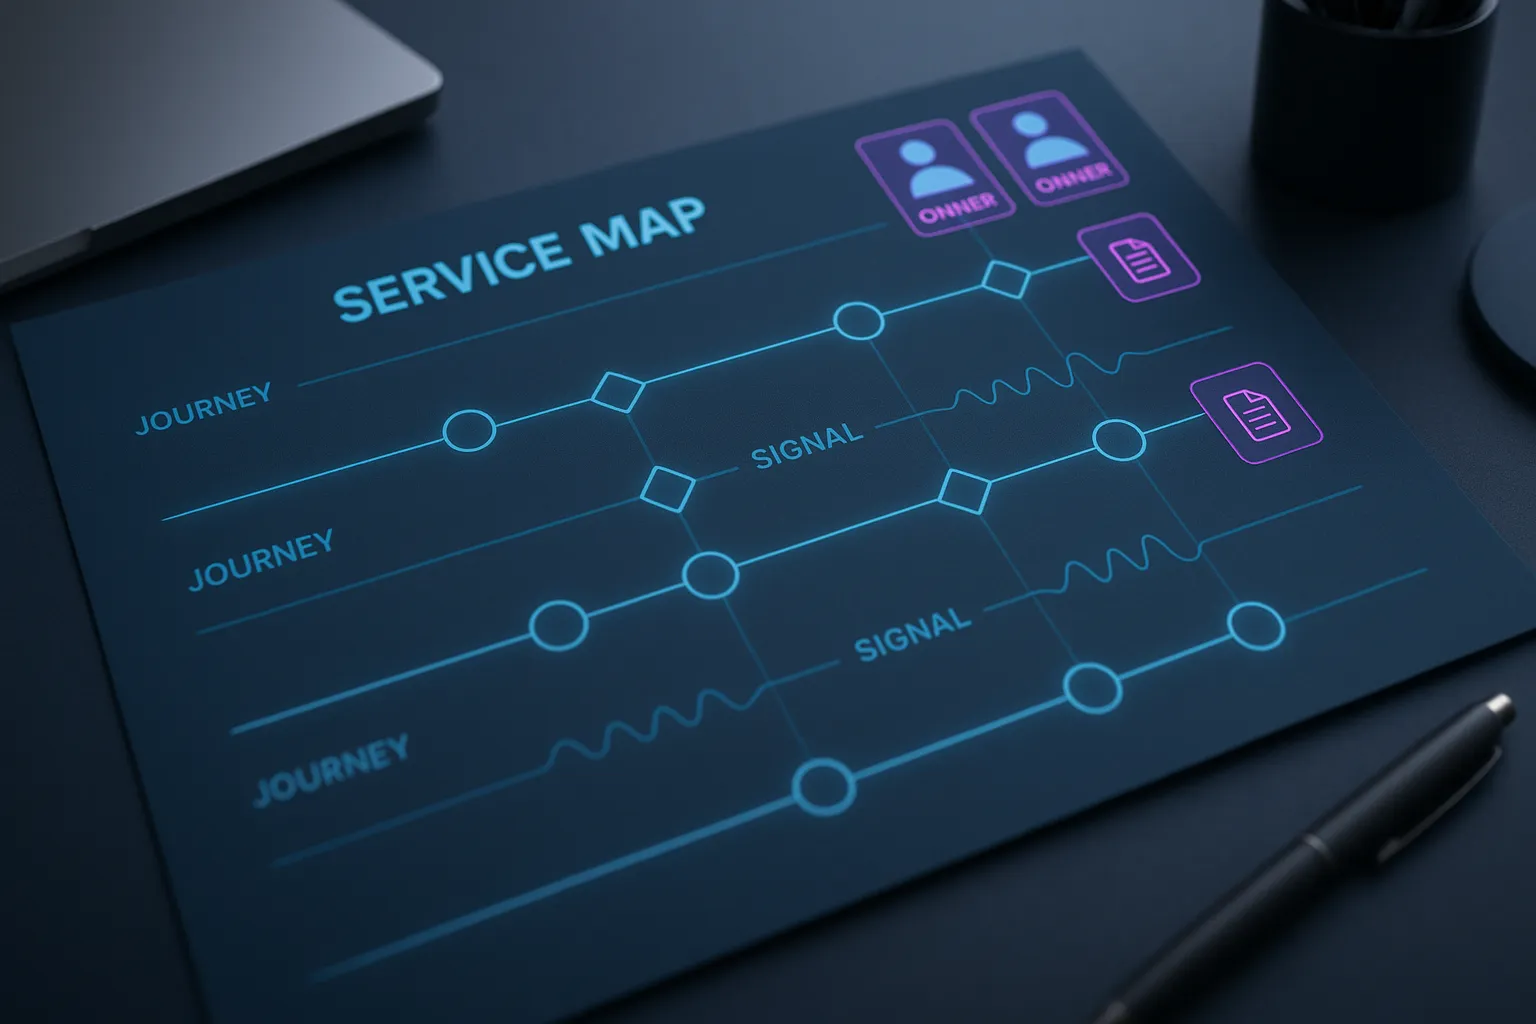
A four-level view that connects to money
Think of your monitoring in four levels. As you move up, the noise drops and the meaning increases.
- Technical signals: error spikes, queue depth, CPU saturation, cache misses. Useful for early detection, noisy on their own.
- Service experience: availability and response time on key paths like login, search, or payment. Now you know if customers feel pain.
- Journey success: the make-or-break steps that move money - checkout completion, claim submission, quote acceptance. If this dips, dollars are at risk.
- Business outcomes: revenue per minute, active orders, new accounts, refunds, churn events. This is why monitoring exists.
Two practical rules make this work:
- Higher levels should carry less noise.
- Each level must link cleanly to the one above it.
If payment response times spike, you should see whether checkout success moves and what that means for revenue at risk. No translation layer. No guessing.
What to avoid
- Metric salad: 40 panels with no hierarchy slow decisions. Keep the few that connect to customer and revenue impact.
- Tool tunnel vision: your monitoring tool looks green while the payment gateway drifts. Journey success exposes third-party issues even when your stack looks fine.
- Late business visibility: waiting for finance data to size the hit. Pair journey success with a simple revenue model so you can estimate dollars in near real time.
Before and after
- Before: “Errors are up but CPU is fine. We are investigating.”
- After: “Checkout success dropped for 7 minutes, estimated $X at risk. Signals point to payment gateway latency. We are rerouting to the secondary provider.”
Quick action
Write one sentence that defines your most valuable digital journey and the exact moment it is successful. Example: “Checkout is successful when payment is authorized and an order ID is returned.” Then list three technical signals that most often threaten that success. You now have the top of your stack aligned to business impact, and your dashboards have a clear purpose.
Connect Business Outcomes to Journey Success
Pick the outcome first
Start with the outcomes your leaders already discuss. Keep the list short:
- Revenue at risk (now): dollars at stake when a money-making journey is degraded.
- Customer impact minutes: minutes when customers could not complete a key task.
- Incident cost trend: business impact across recent incidents to see if fixes work.
If a metric does not help explain or change one of these, drop it from the executive view.
Link the outcome to its drivers
Each outcome has a simple cause chain on your customer’s journey you can quantify:
- Starts - people beginning the journey
- Journey success - share of starts that finish
- Value per completion
- Time - how long the effect lasts
Together: Outcome = starts × success × value × time. This is why journey success is the first driver to watch after the outcome itself.
Examplpe: You chose Revenue at risk. Checkout success drops 3% while 5,000 users per minute try to pay and average order value is $60. Estimated impact is 0.03 × 5,000 × 60 = $9,000 per minute. You used the outcome, linked it to journey success, and got a number leaders can act on.
Put on one screen
Use a simple layout that shows cause and effect:
- Top row - outcomes: Revenue at risk, Customer impact minutes.
- Middle - drivers: Journey success for the chosen task and reliability on its key step, such as payment or authentication.
- Bottom - top causes: two or three technical signals that most often move the driver, like payment errors or slow third-party calls.
When the driver moves, the outcome tile updates. People see what changed and why, not a pile of charts.
Thresholds that trigger moves
Use one simple rule everywhere and compare current values to the 7-day rolling average same day-of-week for that hour.
Two-band rule
- Early warning: -5% to -10% vs baseline - mandatory first glance at the dashboard to confirm scope and look for correlations
- Active response: -10% to -20% vs baseline or a prolonged early warning - execute the preapproved change
Simplified Runbook Example
| Layer | Early warning | Active response |
|---|---|---|
| Business outcomes | Confirm impact window and owner | Run the response play and notify leadership |
| Journey success | Check key step reliability and top causes | Switch to a healthy region or provider, pause heavy features, brief leadership |
| Service experience | Throttle noncritical traffic or scale | Fail over or reroute |
| Technical signals | Validate signals align with service impact | Mitigate the specific driver, then verify the driver and outcome recover |
Stability rules:
- Seasonality guard: compute the baseline by hour and day to avoid false alarms from normal traffic waves.
- Warm-up timer: require a minimum duration (for example, 2 to 5 minutes) before sending the first alert.
- Cool-down timer: wait a short period after recovery before clearing or re-alerting to prevent flaps.
- Routing: send alerts to the most relevant responder based on the layer - business outcomes to the incident lead, journey success to the product owner, service experience to the owning team, technical signals to on-call.
Take It To Next Level With a Transaction ID
Key term: Transaction ID - a unique tag that follows a customer task from start to finish so every system refers to the same event.
Why this matters to executives
- Accurate numbers you can trust: A single Transaction ID prevents double counting when users refresh or revisit pages. It ties product, billing, and marketing data to the same event.
- Faster customer issue resolution: Support can jump straight to the exact order or sign-up using the ID, see all related details, and resolve customer questions quickly. Cuts handling time and repeat contacts.
- Better fraud control: Helps your team spot patterns like multiple failed payment attempts from the same IP address, a sudden spike in transactions from an unusual location, or duplicate orders. Combined with real-time monitoring, you can block risky activity before it becomes loss with a clean audit trail.
What end to end looks like
For each money-making journey, the same Transaction ID appears on three proof points:
- Start of the task
- Key step it depends on - for example, payment or authentication
- Proof of success - order, account, claim, or ticket
How to implement with tools you already have
- Set the standard: Pick the field name (for example,
transaction_id), format, and creation rule. Reuse everywhere. - Instrument the journey:
- Front end - create the ID at journey start and send it with relevant events.
- Back end - carry the same ID through the key step call and response.
- Vendor - negotiate with 3rd-parties on a critical path.
- Business record - stamp the success record with the same ID.
- Connect and surface:
Use your existing log store, APM, or warehouse to line up events by
transaction_idand expose via dashboard for Fraud Ops and Customer Support. - Validate: During a live Customer Support case, trace one ID from start to success. Fix missing links.
Tracking implementation
Just 2 metrics to track:
- Coverage - share of starts, key steps, and success records that include the ID.
- Link speed - time from event to joined view on the dashboard.
Risks and how to handle them
- Vendor gaps: if a provider cannot carry your ID, tag your outbound call and their response so you still connect the dots.
- Privacy: keep the ID random and avoid names or emails. Retain only what you need to learn from incidents.
- Scope creep: start with one journey and one key step, prove the win, then expand.
Quick action
Pick one high-value journey and mandate a standard transaction_id. Ask owners for a one-page plan that shows where it is created, how it flows, where it is stored, and how implementation metrics will be reported.
First Response
Key term: Stop-loss - a reversible step that limits business damage while the root cause is being investigated.
See and confirm
Start with the revenue delta you already track. Before acting, run two checks:
- Seasonality sanity: compare to the 7-day rolling average for the same hour and weekday and check the calendar for known events like national holidays, big sports finals, major TV broadcasts, or promotions.
- 2-of-3 rule: confirm that the dip appears in at least two layers (Journey success, Business outcomes, Key step health). If only one moves, keep eyes on the screen and recheck in a short interval.
Use warm-up and cool-down timers so you avoid alert flaps.
Contain - pick a reversible lever
You are not fixing root cause here. You are buying time with minimal downside. Choose one lever that matches the journey affected and can be undone quickly:
- Shape demand: pause or slow paid campaigns for the impacted path, enable a simple queue page during spikes.
- Limit exposure: hide heavy widgets or experiments on the path, reduce image or script weight, switch users to a known good route.
- Preserve trust: place an in-journey banner, extend timeouts or grace periods, auto-issue a small courtesy credit threshold.
If the dip clears, roll the lever back. If it persists, keep it in place and proceed.
Coordinate ownership and routing
Make decision rights explicit so minutes do not turn into debate, based on the trigger source:
- Journey success - product owner confirms scope and approves exposure changes.
- Key step health - the owning engineering team scales, reroutes, or fails over.
- Vendor - the vendor owner engages the provider and switches routes if preapproved. Alert routing should follow the layer that triggered the 2-of-3 confirmation.
Ecom client saved thousands in lost revenue during Black Friday just by routing payments through backup provider when error-rates spiked on the primary route.
Communicate - one-slide evidence packet
Executives need one clean view. Share a short update that includes:
- What failed, when it started, and the 2-of-3 confirmation
- Current revenue delta and minutes affected
- Lever chosen and why it is safe to reverse
- Owner on point and the next check-in time
Keep the slide in the incident channel so finance, product, support, and engineering share the same facts.
Review and tighten
After recovery, spend a few minutes to improve the system:
- Detection: did seasonality checks and 2-of-3 confirm fast enough without false alarms
- Levers: which reversible step reduced impact with the least customer friction
- Bands and timers: do early warning and active response bands or timers need a slight adjustment
- Playbook: add or retire levers based on what worked, and record any vendor follow-ups
Next steps
- Circulate 2-of-3 rule to confirm real impact with stakeholders, collect feedback and adjust.
- Put one slide for next meeting with business owners listing reversible levers, walk out with at least one lever agreed and approved for implementation.
From signals to actions
You started with a simple problem: system metrics and business outcomes do not line up. This post gave you a way to close that gap so leaders can act with confidence, not guesswork. Apply this framework to your top journey and watch your business and technology teams start speaking same language.