Beyond the Buzzwords
A Tale of Two Problems
- 2003, Google: search traffic is exploding, outages are expensive. Ben Treynor Sloss creates the first Site Reliability Engineering (SRE) team - software engineers who treat uptime as a product feature, enforced by numbers.
- 2007, Belgium: Patrick Debois watches developers and operators blame-swap during a data-center migration. He coins DevOps to end the hand-offs and ship faster together.
Two different sparks, one shared frustration: releasing software was either slow or unreliable. DevOps and SRE evolved as the twin answer - speed and safety.
Five Core Definitions
- DevOps – a working culture plus toolchain that lets ideas travel from code to customers quickly and repeatedly.
- SRE – a role and discipline that measures “how reliable is reliable enough” and puts brakes on delivery when the dial drifts.
- Service Level Indicator (SLI) – a metric the user feels (e.g., error rate, latency).
- Service Level Objective (SLO) – the target value for that metric. Miss it too often, and you’re breaking a promise.
- Error Budget – the amount of risk you’re willing to take (100% – SLO). Spend it on new features; refill it with stability work.
One Engine, Two Pistons
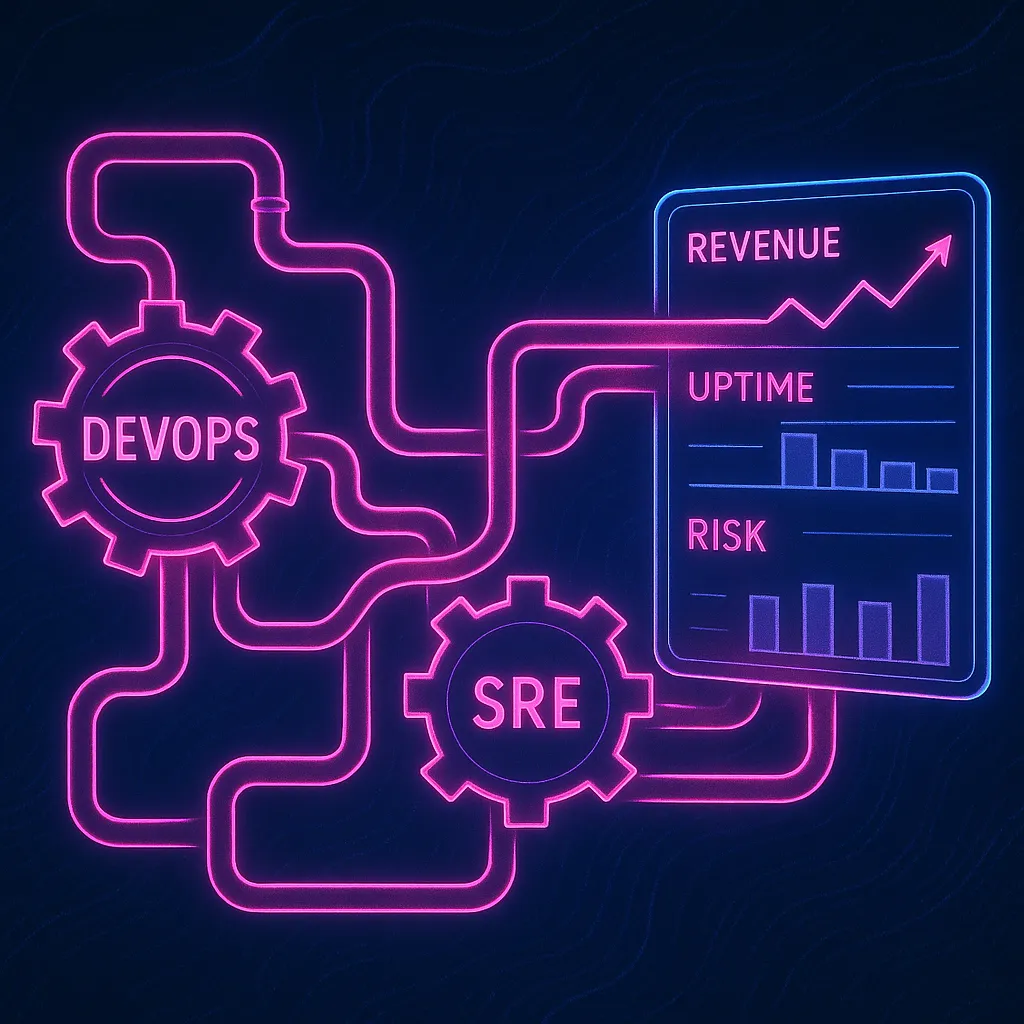
Think of DevOps as the accelerator - automation, continuous integration/delivery (CI/CD), infrastructure as code (IaC). SRE supplies the speed-governor - SLOs and error budgets that force a pause before customers notice pain. Run with only the accelerator and you crash; run with only the governor and you never leave the driveway.
- CI/CD - a set of automated software development practices that help teams deliver code changes more frequently and reliably.
- IaC is the practice of managing and provisioning computing infrastructure using machine-readable configuration files rather than manual processes.
Key Take-Away: Reliability Is Now a Revenue Metric
- A study of e-commerce conversions shows each extra second of page latency cuts basket value by 4%.
- In SaaS, renewal rates drop sharply after three visible outages a quarter.
- Leaders who align launch velocity to a clearly priced error budget see fewer incidents and shorter cash-conversion cycles because new code reaches users sooner.
Translation: reliability is no longer the cost of doing business; it is a lever for growth. When the board asks for “faster features,” SRE gives you the numeric guardrails to say yes - without gambling brand trust.
Try This in the Next Staff Meeting
- Pick one flagship service.
- Write its top two SLIs (choose real user pain points: “checkout error rate,” “video-start delay”).
- Set a 30-day SLO. Simple, public, no dashboards needed.
- Track how many deploys it takes to burn 50% of your error budget. That number is your current safe release pace.
- Ask, “What would have to change - tests, rollout strategy, team skills - to double that pace without blowing the budget?”
The answers reveal exactly where to invest first: better test automation, a canary rollout system, or culture work on shared ownership. No big program plan required - just real data in plain sight.
Three Eras of Digital Delivery - and the Financial Logic Behind Each Shift
1 Control Era - Traditional IT (1990 - 2010)
Old-school change boards treated production like a museum exhibit: look, don’t touch. Quarterly “maintenance weekends” combined thousands of lines of code in a single, late-night release. Superficially the policy felt safe, yet it loaded two silent liabilities:
- Value-at-rest – every unreleased feature is stranded working capital. A $200k-per-month improvement held back three months leaves $600k on the table before customers ever see it.
- Blast radius – big batches amplify fallout. One faulty line in 5 000 can darken an entire site, and each hour offline now costs US $300k or more for 90% of enterprises.
As digital revenue outgrew physical channels, that combination of sunk margin and compounding risk became untenable.
2 Flow Era - DevOps (2010 - 2020)
DevOps reframed delivery as a value stream instead of a queue:
- CI/CD compressed lead-time from weeks to minutes.
- IaC and automated tests made every rollout deterministic, turning deployments into routine operations.
- Feature flags decoupled deploy from release, letting product or marketing decide when new code goes live.
Financial impact: The same $200k-per-month feature now waits 24 hours, not 90 days - shrinking deferred revenue from $600k to $6 600.
Risk trade-off: smaller batches slash blast radius, but velocity surfaced a new problem - stable chaos. At high cadence, customers feel every oversight in real time.
3 Confidence Era - SRE (2020 - present)
Site Reliability Engineering closes the loop by converting “don’t break prod” into an engineered risk budget using just 3 levers:
- Service-Level Indicator (SLI) - Tracks user-visible pain (e.g., checkout errors).
- Service-Level Objective (SLO) - Defines how much pain is tolerable.
- Error Budget - When it’s spent, new features pause automatically.
Elite teams that abide by error-budget policy still deploy many times a day, yet restore service in under an hour and keep change-failure rates in single digits.
Why it matters beyond IT:
- Regulation: the EU Digital Operational Resilience Act (DORA), fully applicable from 17 Jan 2025, demands provable incident governance that maps almost one-for-one to SRE practices.
- Market valuation: Marks & Spencer’s three-week cyber stoppage this spring erased £1 billion in market cap within days as analysts questioned “operational fragility”.
- Investor signalling: a live SLO dashboard is now intangible equity - evidence the company converts strategy to revenue with predictable risk.
Three Eras Recap
- Traditional IT reduced risk by slowing change - an approach that now burns margin faster than it saves cost.
- DevOps recovered the lost cash by accelerating flow, yet needed a new control surface once speed outpaced oversight.
- SRE supplies that surface, pricing reliability as visibly as credit exposure and throttling delivery only when user-experience risk exceeds the agreed budget.
Bottom line: DevOps turns the revenue clock faster; SRE turns risk into a governable line-item. Together they upgrade software delivery from operational expense to a managed financial instrument - one that boards and regulators can audit, and investors reward with a lower cost of capital.
Reflective thought: Which era do you live in?
The ROI Equation - From Velocity to Valuation
Why the CFO Now Reads Deployment Dashboards
In 2024 a Fortune 500 retailer moved one flagship e-commerce squad from monthly to daily releases, guarded by Site Reliability Engineering (SRE) policy. Twelve months later the same head-count generated 18% more revenue and 27% fewer incidents. Finance discovered that every single percentage point of extra uptime added $4.6 million to the annual bottom line. Reliability has jumped from an IT indicator to a direct lever in the profit-and-loss statement.
Four Cash Engines DevOps + SRE Ignite
-
Released capital
Code stuck in a branch is cash no one can touch. Cutting lead-time from 30 days to 30 minutes releases that capital 1 440 × faster. If a feature is forecast to earn $200k a month, a ten-feature backlog ties up $2 million until it ships. Flow turns that projection into bookings.
-
Margin expansion
Infrastructure as Code (IaC) and continuous delivery wipe out repetitive work. Real programmes reclaim a day a week per engineer - roughly 0.2 FTE per person. For a ten-engineer team at $150 k fully loaded, that is $300k-plus of usable capacity each year, free to fund new products instead of routine tasks.
-
Risk de-rating
Public companies hit by a headline outage lose a median 3.5% of market cap within 24 hours. Error-budget policy keeps change-failure rates below 10% and restores service inside an hour, halving the statistical cost of downtime. Lower operational risk earns a richer earnings multiple and cheaper debt.
-
Growth-option value
Fast, safe releases create optionality: marketing can run more experiments, legal can respond to new regulation overnight, and partnerships can launch co-branded features in days. Option theory treats speed as a multiplier on future cash-flow scenarios, further lifting valuation even when immediate revenue is unchanged.
Net effect: DevOps release money faster; SRE stops that money leaking through stability gaps; together they de-risk every future bet the business wants to place.
A Five-Step Quick-Test for Executive ROI
- List one pilot service.
- Collect three numbers: Monthly feature value (A), average lead-time in days (B), hourly revenue at risk (C).
-
Estimate dividends:
- Flow = [(B ÷ 0.5) − 1] × A
- Stability = incident-hours avoided × C
- Productivity = 0.2 × squad salary pool
- Add them.
- Subtract tooling cost - usually under 2% of the upside.
Even conservative inputs typically return payback inside a quarter. Sketch the three dividends as stacked bars on a single slide; the business case becomes impossible to miss when budget talks begin.
Slow Is The Risk Now
Speed alone once looked risky. Today, slow is risk - because every hour of boxed-up value is money competitors can already spend. DevOps plus SRE is not a cost; it is the cheapest hedge you will ever buy against both market volatility and technical debt.
From Snapshot to Roadmap - Measuring DevOps / SRE Maturity
A CEO once asked her CIO, “How far are we from Amazon-level delivery?” The answer - “We deploy weekly and fix outages in two hours” - sounded good until a competitor launched three new features in the same quarter. Without a crisp maturity view, even honest numbers mislead. Clarity begins with a structured check-up that shows where you are, what hurts, and how to advance.
The Three-Lens Check-up
- Flow – How fast can an idea reach a customer without heroics? Look at deployment frequency, lead-time, and the handshake quality between teams.
- Reliability – How often do changes break things and how quickly do you heal? Track change-failure rate, meantime to recovery, and the presence of credible Service-Level Objectives.
- Culture – Do teams own outcomes end-to-end? Gauge psychological safety, learning habits, and the appetite for controlled risk.
These lenses map tightly to the four “elite” DevOps metrics yet surface the softer enablers executive dashboards often miss.
A Five-Level Ladder (in plain English)
- Level 1 - Ad hoc: Releases need all-hands calls; monitoring is a wall of red dots.
- Level 2 - Repeatable: CI pipelines exist but manual gates slow flow; incidents trigger blame hunts.
- Level 3 - Defined: Automated tests guard most changes; SLOs appear for flagship services.
- Level 4 - Managed: Error budgets throttle releases; teams own infrastructure as code; post-mortems are blameless and logged.
- Level 5 - Optimizing: Delivery is daily or on-demand; failure data feeds product strategy; culture rewards experiment speed and stability.
Most enterprises sit between Levels 2 and 3, leaving an obvious, actionable gap to close.
One Week to a Baseline
Day 1: Pick a cross-functional trio - engineering lead, product manager, SRE. Day 2: Gather the hard metrics already collected in CI/CD tools and incident trackers. Day 3: Run a 30-minute survey that scores culture signals (ownership, safety, learning). Day 4: Hold a single workshop to align on current level per lens. Day 5: Translate gaps into three initiatives: one process fix, one automation target, one cultural action.
Five days, no consultants, zero new software.
Why Maturity Beats Benchmarks
Benchmarks compare you to strangers; maturity compares you to yesterday. Executives gain a moving picture: when flow improves but reliability dips, the error-budget policy needs tightening - not another tool. When culture lags despite tooling wins, invest in leadership coaching, not more dashboards.
Take It Forward
Pair this snapshot with a quarterly re-run. Trends, not absolutes, will tell the board whether investments convert into capacity, resilience, and ultimately growth. For readers hungry to start, the next post will include a lightweight assessment template you can copy-paste into your existing project tracker - because knowing the score is the first step to changing it.


