Introduction: Why Monitoring Matters
Imagine your entire company grinding to a halt because one service - tucked away behind layers of code and cloud infrastructure - stopped responding. You didn’t see it coming. Your dashboards stayed green. The alerts were silent. But your customers noticed. And they’re not waiting around.
This isn’t a hypothetical - it’s reality for too many organizations still relying on outdated monitoring practices.
As a CIO, I’ve seen the difference firsthand between companies that treat monitoring as an afterthought and those that treat it like the strategic nerve center it’s become. Monitoring is no longer about just keeping the lights on. It’s about illuminating the path forward - providing visibility, resilience, and business alignment in a world where IT systems are your company’s central nervous system.
So why does monitoring matter now more than ever?
Because IT has evolved from support function to business-critical infrastructure. Whether you’re in banking, healthcare, logistics, or e-commerce, your digital operations are the engine that powers customer experience and revenue growth. A single hiccup in uptime or performance can trigger cascading consequences - from frustrated users to lost revenue to reputational damage.
That’s where IT monitoring steps in. It’s the eyes and ears of your operation. At its most basic, it tells you what’s working and what’s broken. But today, that’s just the beginning.
Modern monitoring offers far more than basic health checks. It’s real-time diagnostics. It’s predictive analytics. It’s the ability to trace a single customer request through a labyrinth of services and pinpoint exactly where something went wrong. It’s your early warning system, your forensic toolkit, your strategy dashboard.
But this wasn’t always the case.
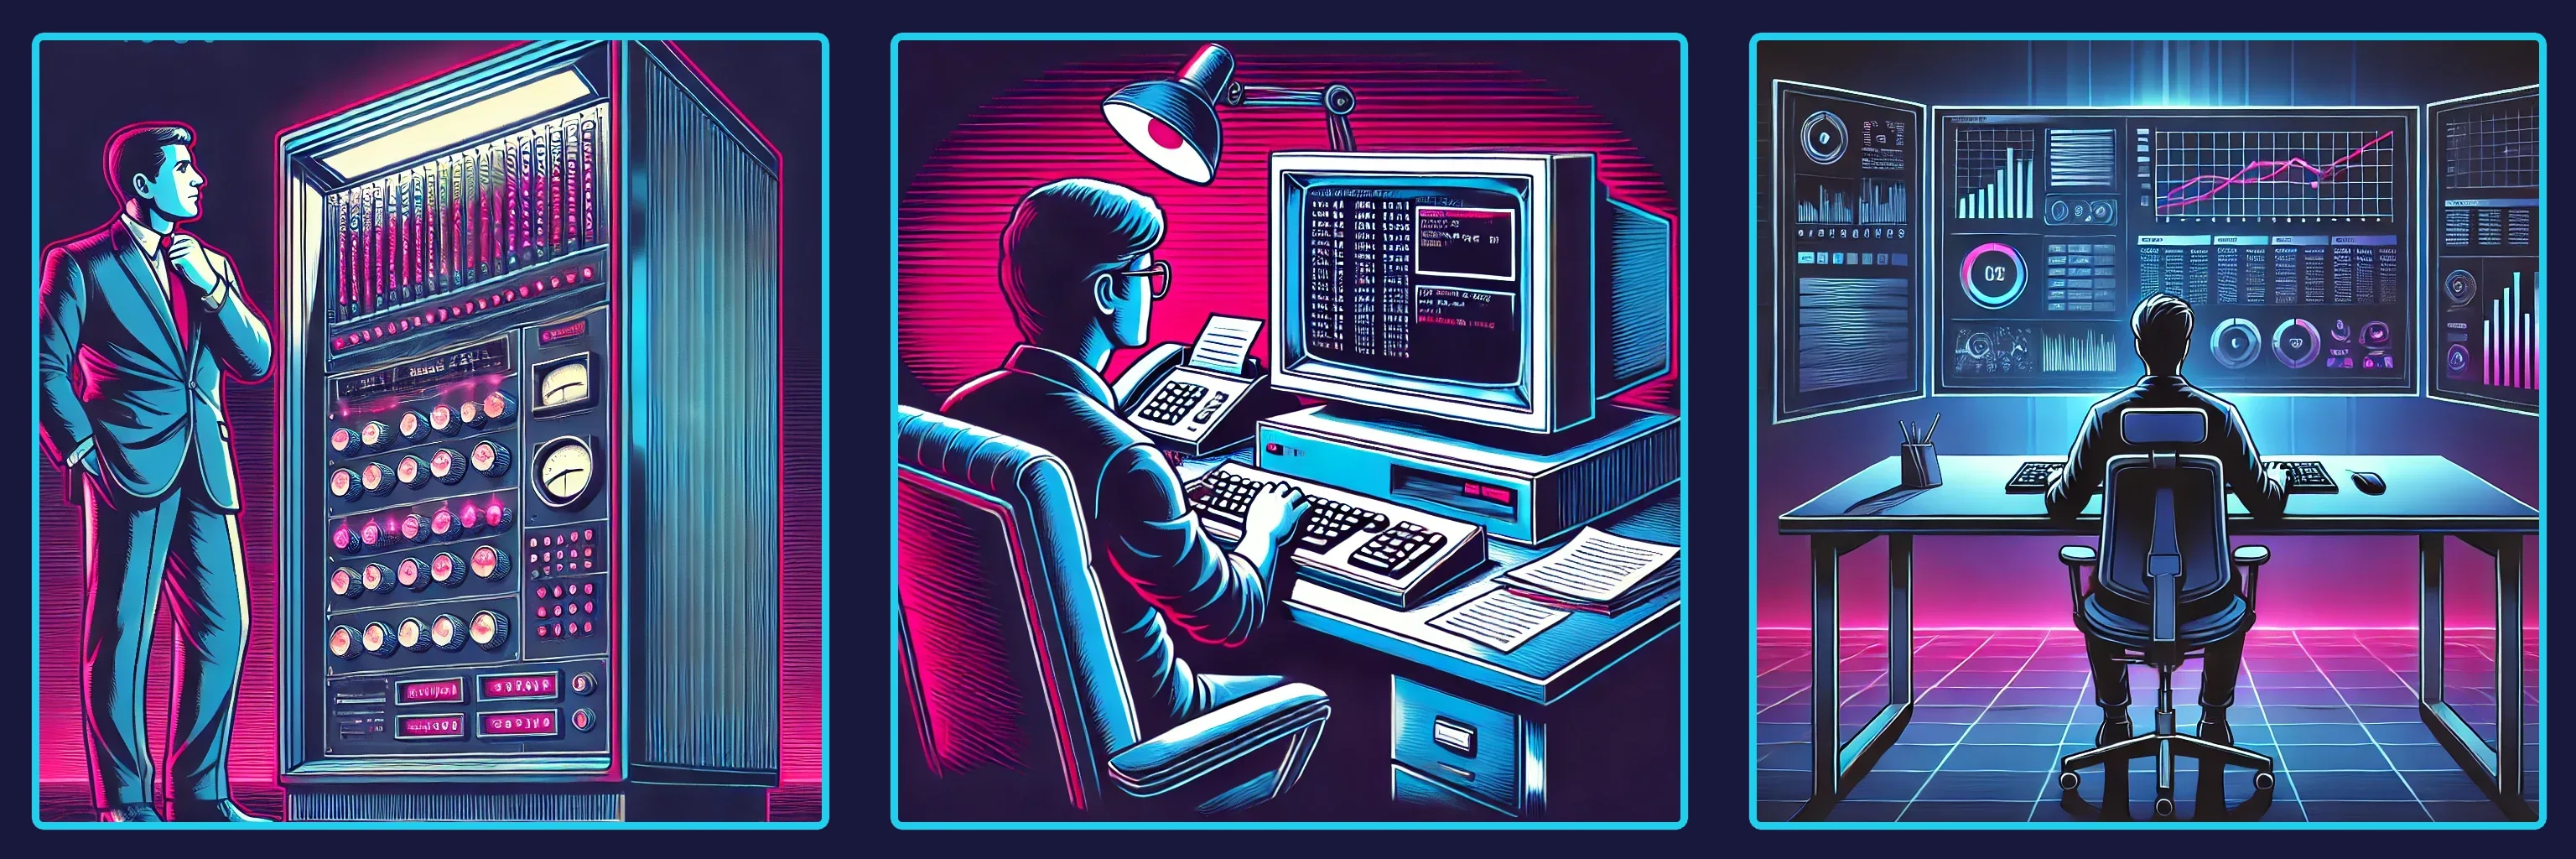
The journey of IT monitoring has mirrored the evolution of technology itself - starting with blinking lights and physical consoles in the 1950s, inching toward command-line tools in the Unix era, evolving into enterprise-scale platforms in the 1990s, and now reaching the era of cloud-native observability and intelligent automation. Each shift brought new capabilities - and new challenges.
Today’s architectures are fragmented, distributed, and ephemeral (short-lived). Cloud services spin up and vanish in seconds. Microservices talk to each other over complex mesh networks. IoT sensors beam real-time data from factory floors and city intersections. In this environment, traditional monitoring breaks down. It can’t keep pace with the velocity, volume, and variability of modern infrastructure.
So what does work?
The answer is observability. Not just in the technical sense - though we’ll get into that in the next post - but as a mindset. A strategic commitment to clarity. It means building systems where you don’t just detect that something failed - you understand why it failed, where, and what to do next.
And it starts with understanding how we got here.
In this post, we’ll rewind the clock and take you on a journey through the key eras in IT monitoring’s evolution. From the earliest manual checks to the rise of automation and cloud-native tools, we’ll explore how each generation built on the last - and what lessons they offer for today’s IT leaders navigating complexity at scale.
Because understanding where we came from isn’t just a history lesson. It’s a strategy lesson.
Ready to see how blinking lights became business intelligence? Let’s dive in and decode the history that shapes your monitoring strategy today.
Early Evolution of Monitoring
From Console Panels to Command-Line Clarity
Picture yourself in a data center sometime in the 1960s. The room hums with the mechanical rhythm of machines. Your monitoring system? A panel of blinking lights and spinning reels. If the lights blinked in the wrong pattern - or not at all - something was wrong. But figuring out what was wrong? That was art, not science.
Early IT monitoring was purely physical and deeply manual. Operators learned to “read” their systems by memorizing patterns on indicator panels, scanning punch card stacks, or listening for abnormal sounds from tape drives. There were no dashboards, no alerts, no logs - only intuition, discipline, and relentless vigilance.
Hooked yet? Good - because this low-tech reality laid the groundwork for one of the most strategic transformations in IT.
Unix and the Rise of Command-Line Visibility
Fast forward to the 1970s and 80s. The computing world shifted from monolithic mainframes to more distributed Unix-based systems. With that shift came a turning point: the advent of monitoring tools.
At Bell Labs, an engineer created a small utility to solve a problem - a runaway process eating up resources on a shared system. That utility became top. What once took hours of sleuthing could now be solved in seconds.
The Unix philosophy - small tools that do one thing well - translated beautifully into early monitoring. vmstat, iostat, netstat, and later Syslog empowered administrators to see, interpret, and act in real time. This era introduced the concept of proactive monitoring - a way to catch problems before users did.
For the first time, system state could be observed without waiting for disaster. Logs could be stored and reviewed. Patterns could be recognized. And incident response became faster - if not yet strategic.
But with capability came complexity.
The Enterprise Era: Networks, Protocols, and the Visibility Problem
By the late 1990s, IT systems had grown exponentially. Networks spanned buildings, cities, and continents. Data centers filled with heterogeneous systems. Monitoring could no longer be manual or limited to one server at a time.
This new scale created a new pain: a single misconfigured router, unnoticed hard drive failure, or cooling system fault could ripple across the enterprise. And someone had to spot it before it escalated.
Enter tools like Nagios, Zabbix, and Munin - early open-source monitoring platforms that could integrate with protocols like SNMP and NetFlow. These tools monitored systems across entire data centers, alerting administrators via email or pager when anomalies were detected.
For the first time, IT teams began to shift from reactive firefighters to proactive guardians. They could track performance trends over time. Forecast capacity needs. Justify infrastructure budgets with hard data. Some companies reported saving up to 20% on infrastructure upgrades simply by knowing when - not just what - to scale.
But the tools of the time were still limited. They produced alerts, not answers. Dashboards were static. Context was scarce. And each team - network, database, application - often had their own monitoring stack, siloed from the others.
Still, this era taught an enduring truth: visibility at scale requires integration. And integration, when done right, enables strategy.
So what should we take from this?
Each step of monitoring’s early evolution - from console panels to unified dashboards - was driven by one idea: make the invisible visible. And that’s still the goal today.
As IT environments scale, integrate, and diversify, the need for real-time insight becomes more acute. Modern teams have inherited powerful capabilities from this lineage - but they’ve also inherited a responsibility: to use those capabilities to not just see the system, but to understand and optimize it.
Next, we’ll explore the era that brought a seismic shift to that goal: the cloud-native revolution. When infrastructure stopped being something you owned and started being something you orchestrated, the rules of monitoring changed - dramatically.
Ready to see how containers, Kubernetes, and real-time telemetry reshaped the game?
Let’s keep going.
The Cloud-Native Revolution
Why Yesterday’s Tools Can’t Solve Today’s Problems
Imagine trying to monitor a highway system where the roads keep shifting, the cars change shape mid-journey, and traffic patterns morph every minute. That’s what modern infrastructure feels like. And trying to apply old-school monitoring methods to this dynamic world? It’s like using a map from 1998 to navigate real-time traffic in 2025.
This is the heart of the cloud-native revolution - a seismic change in how we build and run systems, and just as importantly, how we monitor them.
From Static Servers to Ephemeral Everything
Traditional monitoring assumed one thing above all: stability. Servers had names. IP addresses didn’t change. Apps lived on fixed infrastructure. You knew where things were, and you could set thresholds and alerts based on that relative predictability.
Then came containers. Kubernetes. Microservices. Auto-scaling. Serverless.
Suddenly, infrastructure became elastic. Workloads moved. Services were deployed in seconds and destroyed minutes later. What used to be monitored once a day now needed second-by-second visibility.
And so, a new kind of monitoring was born: cloud-native observability.
Enter Prometheus, Grafana, and the Rise of Dynamic Telemetry
Last year, idustry survey mentioned an European software company reduced it’s mean time to resolution by 40% after adopting Prometheus for real-time telemetry and Grafana for intuitive dashboards. It wasn’t magic - it was visibility, tailored to the cloud-native world.
Prometheus introduced time-series metrics at a resolution and flexibility the industry hadn’t seen before. Metrics could be scraped from dynamically registered endpoints. Labels made querying fluid and powerful. Dashboards adjusted automatically as services scaled up or down.
Grafana took it further - turning raw numbers into accessible, real-time visualizations that could be sliced, filtered, and shared across teams.
Together, they unlocked a critical shift: observability became self-service.
Now, developers could monitor their own services. Product teams could track user-facing KPIs directly. And operations teams could visualize performance trends across clusters, clouds, and geographies - without waiting for custom integrations or static dashboards.
Why Cloud-Native Changed the Game Entirely
The cloud-native era didn’t just introduce new tools. It demanded a new mindset.
- Everything is dynamic. Monitoring must adapt in real time.
- Everything is distributed. Observability must connect the dots.
- Everything is decoupled. No single system “owns” the full picture.
In this world, logs, metrics, and traces don’t just coexist - they must converge to tell a coherent story. And that’s where modern platforms - like Prometheus, Datadog, Sysdig, and newer OpenTelemetry-based systems - shine.
They treat observability as a first-class concern. Not a bolt-on. Not an afterthought. But a strategic layer that spans the entire application lifecycle.
From deployment to incident to postmortem, observability isn’t just a tool - it’s a competitive advantage.
What’s in it for today’s CIO or CTO?
If you’re still relying on legacy monitoring tools built for a static world, you’re not just behind - you’re walking in the dark.
Cloud-native observability doesn’t just help you detect failure. It helps you understand it, prevent it, and optimize against it. It gives your teams confidence to move faster without sacrificing control. It creates alignment between operations and outcomes. It turns telemetry into insight - and insight into action.
And in a world where customer expectations are rising and tolerance for downtime is near zero, that kind of responsiveness is a strategic asset.
In our next and final section of this post, we’ll look at how monitoring has extended beyond the cloud - into factories, edge devices, and smart cities. We’ll show how the principles forged in data centers are now reshaping the physical world.
The edge isn’t the end of the story. It’s just the next chapter.
Let’s turn the page.
Monitoring at the Edge - and What It Taught Us
When Machines Talk Back, You Better Be Listening
A wastewater plant in Germany cut repair costs due to unscheduled maintenance by 30% after wiring its machinery with IoT sensors and pushing telemetry through a lightweight edge observability stack. The real game-changer? Not just the monitoring - it was the insight. They didn’t just know something failed - they knew when, why, and what to do next.
That’s the edge revolution.
We’re no longer just monitoring servers in racks or containers in the cloud. We’re monitoring turbines, traffic lights, agricultural drones, and retail sensors - devices at the literal edge of the network. These systems operate in harsh conditions, often with limited power, connectivity, or compute. And yet they’re expected to deliver the same level of insight as their cloud counterparts.
The rules have changed again.
Lightweight, Local, Real-Time
Edge observability isn’t just a scaled-down version of traditional monitoring - it’s a rethinking of priorities. Tools like Telegraf, InfluxDB, and Grafana allow local data collection, compact storage, and efficient visualization even in environments with constrained resources.
Why does that matter?
Because in a smart city project or industrial automation deployment, latency and bandwidth aren’t theoretical issues - they’re existential. You can’t afford to send gigabytes of raw telemetry back to a central data lake and then make a decision. Monitoring at the edge means acting at the edge.
It means local intelligence. Real-time decision making. Proactive intervention before failure cascades.
And more importantly: it means empowering operators on the front lines with data they can trust.
But Here’s the Catch…
The edge brings its own headaches.
- Data overload: Thousands of sensors can produce millions of events per day.
- Security risks: More endpoints mean more surface area for attack.
- Integration pain: Each device might speak a slightly different language.
- Operational blind spots: Traditional dashboards don’t stretch that far.
This isn’t just a scale problem. It’s a complexity problem.
Which is why modern observability strategies must go beyond collection - they must emphasize context. Because without it, telemetry becomes noise. And noise is the enemy of insight.
That’s why successful edge monitoring efforts - whether in retail, logistics, or smart manufacturing - invest just as much in filtering, prioritization, and visualization as they do in collection. They distill chaos into clarity.
So what are the takeaways from this journey?
After tracing monitoring from blinking console lights to container orchestration, and now to global IoT ecosystems, one truth stands out:
Monitoring isn’t about tools. It’s about trust.
Can you trust your systems to tell you what’s really happening?
Can your teams trust the data to guide their decisions?
Can your business trust your IT to respond before your customers feel the pain?
Here are three enduring lessons that emerged from this evolution:
-
Proactive always beats reactive.
From mainframes to microservices, early insight has always been the game-changer. Waiting for alerts is too late. -
Integration is everything.
Siloed metrics or logs help no one. The power lies in connecting dots across systems, layers, and environments. -
Clarity enables speed.
Whether it’s a dashboard, trace, or log, if it’s not clear, it’s not actionable. Insight needs to be intuitive - because in a crisis, no one reads the manual.
As we close this post, we’ve laid the groundwork for where we’re headed next: into the world of modern observability - what it is, how it’s different from traditional monitoring, and how it empowers organizations to shift from “watching systems” to orchestrating outcomes.
If monitoring gave us visibility, observability gives us understanding.
And that understanding? It’s where the real strategic power lives.
Stay with us. We’re just getting started.


