Understand the Four Pricing Levers (and the Fees Hiding in Plain Sight)
“Why does the same 4-CPU virtual machine show six different prices in your dashboard?” Because cloud pricing isn’t one number; it’s four intertwined levers, each with its own risk-reward dial.
Every cloud bill is governed by four pricing levers, not a single rate.
1. Decode the Pricing Levers
On-Demand (Pay-as-you-go)
Default, meter-per-second rate. No commitment, no discount. Ideal for experiments and short-lived bursts.
Commitment Discounts
- Committed Use Discounts (Google), Reserved Instances / Savings Plans (AWS), Reserved VM Instances (Azure).
- You trade term-length (1- or 3-year) and payment style (all-up-front, partial, or none) for deep cuts - up to ~72% off the same VM on a 3-year term.
- Convertible or flexible variants cost a bit more but let you swap instance families if the roadmap shifts.
Even a low-margin SaaS startup can lift gross margin 2–3% with zero upfront fees.
Spot & Preemptible Capacity
“Airline standby seats” for compute. You bid for spare capacity and can save 70-90%, but the workload must tolerate a two-minute eviction notice - ideal for short-living containers.
Enterprise & Private Pricing Agreements
Commit more than $1 M a year and the provider builds a custom, tiered discount across its catalog (Azure MCA, AWS EDP, Google CUD-SP). Think of it as volume pricing for everything you deploy. Typical blended cuts land in the 10-25% range on top of other levers and include credits for migration or support.
Key definition: Effective Price = Invoice Spend ÷ Actual Usage Hours. It’s the only metric that normalises across every lever.
Rates are only half the story - behavioral fees lurk underneath.
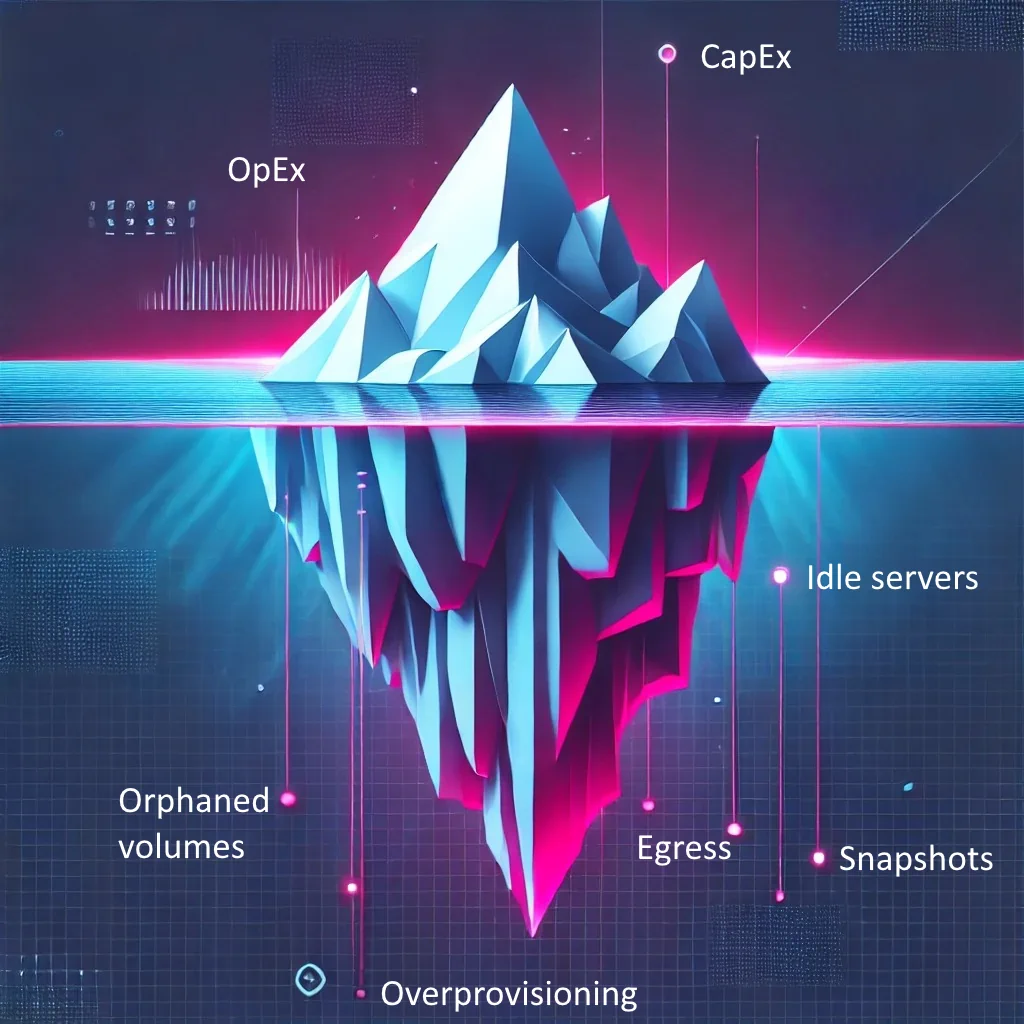
2. The “Iceberg” Costs Below the Line-Item
Cloud providers sell you usage, but bill you for behavior. Even perfect rate optimization can be wiped out by overlooked add-ons:
- Data egress: $0.09/GB to the public internet for the first 10 TB on AWS; even intra-AZ traffic costs money.
- Premium networking & NAT gateways: (managed service that lets private subnets reach the internet) double-dip charges - per-hour and per-GB.
- Extended support tiers & proactive credits: mandatory in many enterprise deals.
- Regional price deltas: a Singapore VM can be 15–20% pricier than Virginia.
Mini-case: A mid-market SaaS firm took a 22% blended discount via three-year Savings Plans - then watched net spend rise 9% because nightly data-lake exports added 18 TB of unexpected egress each month. Commitment without behavior alignment is a rounding error.
Why Boards Care?: Unchecked egress can turn a 72% ‘discount’ into negative unit economics - visibility at the C-suite level is non-negotiable.
3. Pricing Hygiene Check
Spend no more than 5 minutes answering these in your next ops stand-up:
- Which workloads are still 100% On-Demand after 30 days in prod?
- What % of compute hours ran on Spot/Preemptible last week?
- How many terabytes left your VPC/VNet yesterday - and why?
- When does each existing commitment term expire?
- Do we have an enterprise agreement renewal window inside the next 12 months?
If you can’t tick these off today, that’s your first ROI opportunity - before we get to optimization tools later in the series.
Beyond The Four:
Watch for provider-specific promos, so you don’t miss other optimization opportunities (i.e. ARM-based Graviton VMs now come with additional 15% discount).
CapEx to OpEx: The CFO’s New Reality
Cloud doesn’t just move servers off-prem - it shifts risk, cash flow, and valuation in ways that ripple through every finance metric you track.
What Changes When Servers Become Services
Capital Expenditure (CapEx) is money tied up in long-lived assets such as racks of servers. Under GAAP/IFRS the spend is capitalized and then depreciated - usually straight-line - over three to five years.
Operating Expenditure (OpEx) is pay-as-you-go spending that hits the income statement the month it occurs. When servers become subscriptions:
- No upfront cash lock-in. Liquidity improves on day one, unlocking capital for R&D and other strategic investments.
- Instant scalability. You can cut spend as fast as you add it - if engineering disciplines usage.
- Continuous compounding. Idle resources now burn real dollars every hour, not just lost depreciation headroom.
The cloud path ties up less capital up front but starts more expensive from month one - hence the need for continual optimization.
Accounting Impact on Key Metrics
- EBITDA (Earnings Before Interest, Taxes, Depreciation, Amortization) rises because depreciation disappears.
- Gross margin may fall if variable usage isn’t offset by pricing discounts.
- Free cash flow often strengthens in migration year but can erode if spend drifts.
- DCF (Discounted Cash-Flow) valuation must model a perpetual run-rate instead of a refresh cycle - raising the strategic value of cost controls.
Rule of thumb: every $1 of monthly cloud OpEx equals roughly $12 of annualized run-rate commitment - use that multiplier when projecting three-year impact.
Cash-Flow Simulation: 36-Month Lens
Imagine a logistics platform that needs 1 000 vCPUs and 4 PB of storage.
-
On-prem:
- $5 M server + SAN purchase in Month 0.
- $85 k/month for maintenance, power, cooling.
- Depreciation: $1 M/year straight-line over five years.
-
Cloud:
- $0 CapEx.
- $280 k/month On-Demand.
- After optimization (commitments + right-sizing) drops to $200 k/month by Month 6.
- Optional three-year Savings Plans save a further 18% but lock spend.
Outcome: Cloud stays cash-positive for a little over three years - up to about Month 40 - after which its cumulative spend overtakes the on-prem path. If you can push the steady-state cloud bill a full 30% below list (≈ US $140 k/month), the break-even point slips far to the right - out near Month 75 - making continuous FinOps a non-negotiable discipline.
Quick back-of-the-napkin math:
TCO = (Cost of Purchase) + (12 x Monthly Operating Cost) x Years. SwapCost of PurchasewithCost of Migration(if appropriate) for a Cloud TCO.
Want quick comparison? Put CapEx/OpEx numbers into our TCO Comparison Tool and get quick insight on NPV, IRR and understand months to break-even in seconds.
Cash timing is only half the equation; now let’s address budgeting variable spend.
Budgeting for a Bill That Breathes With the Business
Rolling forecasts, commitment calendars, and guardrail alerts remain the baseline controls for cloud spend. Those still tell you how much you are spending and signal when actuals drift off-course. What they do not tell you is whether the spend is buying proportionate value. That gap is filled by an outcome-driven model that links cloud cost to a business key-performance indicator (KPI).
The Outcome-Driven Model
-
Pick a KPI-aligned unit.
- Retail: cost per order shipped
- SaaS: cost per active user per month
- Streaming: cost per viewing hour
- API platform: cost per million calls
-
Calculate today’s unit cost.
Unit Cost = Last month’s cloud invoice / last month’s unit countExample: $420 000 ÷ 10 000 000 orders = $0.042 per order. -
Set a target band.
Decide the maximum cost per unit that still protects margin - say $0.045.
-
Forecast in two dimensions.
Multiply next month’s volume forecast by the unit-cost target to create a variable budget that flexes with growth instead of fighting it.
-
Monitor the ratio, not just dollars.
Trigger an alert when unit cost rises 8% above target, even if total spend is on plan.
Integrating Both Approaches
- Traditional controls keep the lights on:
- Rolling forecast updates
- Commitment-renewal calendar
- Spend guardrails
- Outcome-driven controls prove value delivered:
- KPI-linked unit cost
- Ratio guardrails
- Quarterly recalibration of the target band
Use the first to contain volatility; use the second to show every extra dollar drives revenue, margin, or user value.
Quick Start
Add one slide to the next finance review:
- Last month’s cloud spend
- Last month’s KPI volume
- Resulting unit cost vs. target band
- Trend arrow (↑ / ↓) over the past three months
Spend 5 minutes and gain an immediate view of whether cloud spending is pacing value creation - or eroding it.
What Really Drives Your Cloud Bill
The cloud provider’s price list rarely causes a runaway bill - your architecture and day-to-day operating habits do. Spot the signals early and you’ll flatten the spend curve long before Finance has to ask.
From Line Items to Cost Vectors
Think of each dollar as travelling along three cost vectors:
- Capacity Waste – silent CPUs, over-provisioned memory, forgotten snapshots.
- Data Gravity – fees that snowball as data moves between zones, regions, or out to the internet.
- Service Premiums – managed databases, serverless glue, GPU or AI accelerators that trade convenience for margin.
| Cost Vector | Leading Indicator | Lagging Cost |
|---|---|---|
| Capacity Waste | Average CPU utilization < 40% for 24 h | Idle compute / storage hours |
| Data Gravity | Cross-region egress > 5% of total traffic | Transfer and replication fees |
| Service Premiums | Managed-to-self-hosted spend ratio ↑ 10% MoM | PaaS line-item growth |
Case Snapshot - Chattiness Tax Uncovered
A fintech with 220 microservices watched cross-region egress double in two months. Closer look revealed two analytics jobs flinging 90 GB daily across regions - pure Data Gravity. Co-locating them in the same availability zone cut transfer by 93%, trimming $26 000 from the monthly bill with zero code change.
Ownership Gaps - The Human Driver
40% of FinOps practitioners say their top challenge is getting engineers to act on cost data.
When feature velocity is the only KPI, developers often lack financial discipline:
- Default to the “one-size-up” instance
- Leave test clusters running overnight
- Spin up shadow accounts.
Until cost accountability sits with the code owner, every discount is delusional.
One team I worked with cut their Dev/Test cloud bill almost 60% just by automatically shutting down environments at 7pm.
Quick win: add effective price per request to the same dashboard that shows latency and errors; cost becomes just another SLO (Service Level Objective).
Stage Drift: Non-Prod Sprawl
Non-production environments can consume up to 20% of an enterprise cloud bill - often without serving a single customer.
| Environment | Typical Ratio vs. Prod | Common Waste Pattern |
|---|---|---|
| Development | 1 : 1 | Always-on VMs for every branch |
| QA / Test | 2 : 1 | Duplicate DB snapshots nightly |
| Demo / Staging | 1 : 1 | Idle 18 h per day between demos |
TTL tags on every non-prod resource (default seven days) and scheduled hibernation after 19:00 local time reclaim quick savings without code changes.
Old lift-and-shift estates create a different class of waste - oversized VMs.
Legacy Baggage - Lift-and-Shift-and-Forget
VMs ported verbatim from on-prem often carry four times the CPU and memory needed once they reach an elastic platform. Any workload averaging < 30% utilization is a prime refactor candidate: rightsizing a 1 000-vCPU lift-and-shift to 260 vCPU saves roughly $150 k per year at mid-tier prices.
The Diagnostic Flywheel
- Instrument – Tag resources by team, cost center, project, and environment at creation.
- Surface – Publish weekly leading-indicator graphs next to latency and error rates.
-
Act – Apply the 4 Rs:
- Right-size – downshift when peak-time CPU < 40%.
- Repurpose – co-locate chatty services in one VPC or region.
- Refactor – move burst analytics to Spot or serverless.
- Retire – delete snapshots, orphaned load balancers, abandoned PoCs.
- Review – In the first 10 minutes of every sprint retro, ask: Did the action bend the curve?
High-maturity FinOps teams using a loop like this report waste below 20% - versus ≈ 32% for the average organization.
Plan This Week
- Pull last week’s utilization report; flag any production service < 40% CPU.
- Run a cost-allocation query for cross-region data transfer; list the top two offenders.
The Hidden Costs Beyond the Invoice
A cloud invoice is the loud-and-clear price of usage. A quieter meter keeps running in the background - fed by people, policy, and events you don’t control.
Lock-In and Exit Friction
When strategy changes - an acquisition, a regional exit, a product sunset - the price of switching clouds (or moving back on-prem) becomes real.
- Data-gravity tolls. Standard egress can be $90 per TB; at scale the “get-out” fee overtakes the storage line-item itself.
- Repatriation projects. Companies that tried to lift large analytics datasets back in-house report six-figure egress invoices before buying a single server.
Guardrail: keep stateful layers portable (Kubernetes, Postgres, object-store abstractions) and negotiate capped-egress clauses during enterprise-agreement renewals.
The Talent Premium
Fast cloud work needs people who already know the terrain - and they cost more.
- A relevant certification badge adds roughly 30% to a engineer’s salary.
- Senior cloud architects now command US $150 k–230 k - well above generalist roles.
Guardrail: budget an extra 5–8% of project OpEx for training or contractor capacity, and build an internal certification path to keep knowledge (and spend) in-house.
Compliance and Sustainability
Compliance rarely shows up as a separate line on your AWS or Azure bill, yet the rules below - and the engineering responses they force - can nudge total cloud spend by mid-single-digit percentages. Here’s how.
1. Digital Operational Resilience Act (DORA) – Resilience by Regulation
From 17 Jan 2025 every EU bank, insurer, and investment firm must prove it can keep critical systems running if a full region goes dark. Inspectors can demand evidence of:
-
Multi-region replication for “critical or important” workloads.
- Moving from two EU regions to three adds a third copy of every object plus inter-region transfer. For a 50 TB data lake that’s roughly €3 300 extra per month in storage and egress.
- Quarterly fail-over tests, which spin up duplicate clusters for hours and burn compute you’ll never see in production.
- Exit-strategy rehearsals (code + data export) that translate into snapshot fees and engineer time.
Guardrail: tag DORA-scoped workloads today; keep them in a separate account so the replication multiplier is obvious - and negotiable - at budget time.
2. EU Data-Residency & Sovereign Cloud – Premium Geography
To calm privacy regulators, AWS, Microsoft, and Google now offer “sovereign” EU-only clouds. These regions run on segregated control planes and staff, and early pricing mirrors historic Germany-only zones that carried a 15–25% premium over standard Western-Europe regions.
Teams that must keep every byte inside the EU (public sector, health, defence) will feel that uplift immediately - before a single CPU cycle is optimised.
Guardrail: if you’re forced into a sovereign region, keep stateless layers (front-end, caches) in cheaper neighbouring regions and pin only the regulated data at the premium site.
3. Corporate Sustainability Reporting Directive (CSRD) – Carbon Accounting as a Cost Centre
From FY 2024, large EU-based and many non-EU companies must disclose Scope 3 emissions - cloud usage included. AWS and Azure share regional emission factors, but Finance still needs auditable, product-level splits. Most enterprises are buying SaaS platforms such as Persefoni:
- Carbon-accounting licences start around US $ 25 k–100 k per year depending on data volume and audit scope.
- Consulting and integration projects to map tags → cost → emissions often match the first-year licence fee.
Guardrail: attach “business-unit” and “environment” tags at resource creation; this cuts CSRD data-wrangling time by up to 70%.
Building a Realistic Compliance Buffer
| Driver | Typical uplift you should model |
|---|---|
| DORA multi-region replication | +3–5% on affected workloads |
| Sovereign / premium regions | +15–25% for data stored there |
| CSRD carbon tooling & audits | +1–3% of total cloud OPEX |
Add these percentages to the three-year TCO you calculated earlier and revisit them annually. By turning hidden mandates into explicit budget lines, you keep compliance from becoming a mid-project surprise - and protect the ROI story you’re telling the board.
Market & Currency Shocks
Even a perfectly tuned architecture can get blindsided by forces outside IT.
Currency example - EUR/USD 2022: At the start of 2022 one euro bought US $1.14; by late September it bought US $0.95 - a 16% slide. A European SaaS firm paying AWS in dollars saw its €500 k monthly invoice jump to €580 k overnight, with no change in usage.
Other shocks to watch
- New premium SKUs widen the price gap between legacy and modern services.
- Spot-GPU prices can spike 2-3× during AI demand waves.
- Regional tax changes or energy levies flow straight into variable costs.
Guardrail: diversify commitments across two regions or clouds, and refresh pricing baselines quarterly - not annually.
Budgeting a Real-World Risk Buffer
- Start with the three-year TCO you calculated above.
-
Add cushions:
- Lock-in friction +3–5%
- Talent premium +5%
- Compliance/carbon +2–15% (if applicable)
- Currency hedge +1–3% for multi-region billing
- Re-check the buffer each year against actuals and market moves.
Closing Thought
The invoice shows today’s cost; the hidden meter shows tomorrow’s risk. Build both into the model and you’ll arrive at board meetings with fewer surprises - and a strategy that stands up when the macro winds shift.
Wrap-Up: Put the Numbers to Work
Cloud economics is no longer a mystery. Act on those four now and cut 20% of waste in a quarter.
- Pricing levers set the sticker price.
- CapEx-to-OpEx shifts move risk and cash across the ledger.
- Behavioral drivers inflate the bill when habits lag behind scale.
- Hidden meters - resilience mandates, sovereign regions, carbon reporting - tick in the background.
Individually each adds or trims a few percent. Together they decide whether the cloud is a growth engine or an unplanned tax.
Best ROI on Your 15 Minutes This Week
- Run quick TCO formula and frame decision in dollars, not instinct
- Check one leading indicator for each cost vector to find waste before month-end closes
- Apply a sector-specific compliance buffer to bullet-proof your budget
Fifteen minutes, one clear snapshot - ready for your next leadership call.
Pro-tip: add financial indicators from TCO Comparison Tool.
Share the one-page report with Finance and start an evidence-based conversation.