This post explores how to map one business service on a page, find the critical path, and tie change to Business-SLO gates—so you protect peak revenue, cut signal to decision time, ship safely, and keep vendor risk under control.
Case study: the critical service failure despite 99.9% uptime
Key term: Business service - a customer outcome you can measure and own (for example, Checkout or Claims Approval)
Black Friday evening. Dashboards glow green. The incident channel is quiet. Support starts to hear the same note from the field - “payment spinning.” Minutes later, finance flags a dip in authorized orders. The site is “up,” yet money is slipping away.
This is how it happens. Teams watch components. Leaders run the business. The translation layer is missing. A third-party tax call slows just enough to push payment past the patience of browsers and gateways. Retries stack up. Customers refresh. Some give up. Nothing on the infrastructure view screams red because every box that team owns is still within its thresholds.
At peak on Cyber Monday 2024, shoppers spent $15.8M per minute. If you are blind during a peak window, that is real money gone.
What went wrong here is not a single bug. It is an alignment gap. Component health said OK. Service health was not even on the screen. No one had drawn the line from “tax API slowdown” to “checkout success” to “revenue at risk now.” Without that line, minutes turn into debate. The room asks, “Are we making or losing money right now because of a technology issue?” Silence.
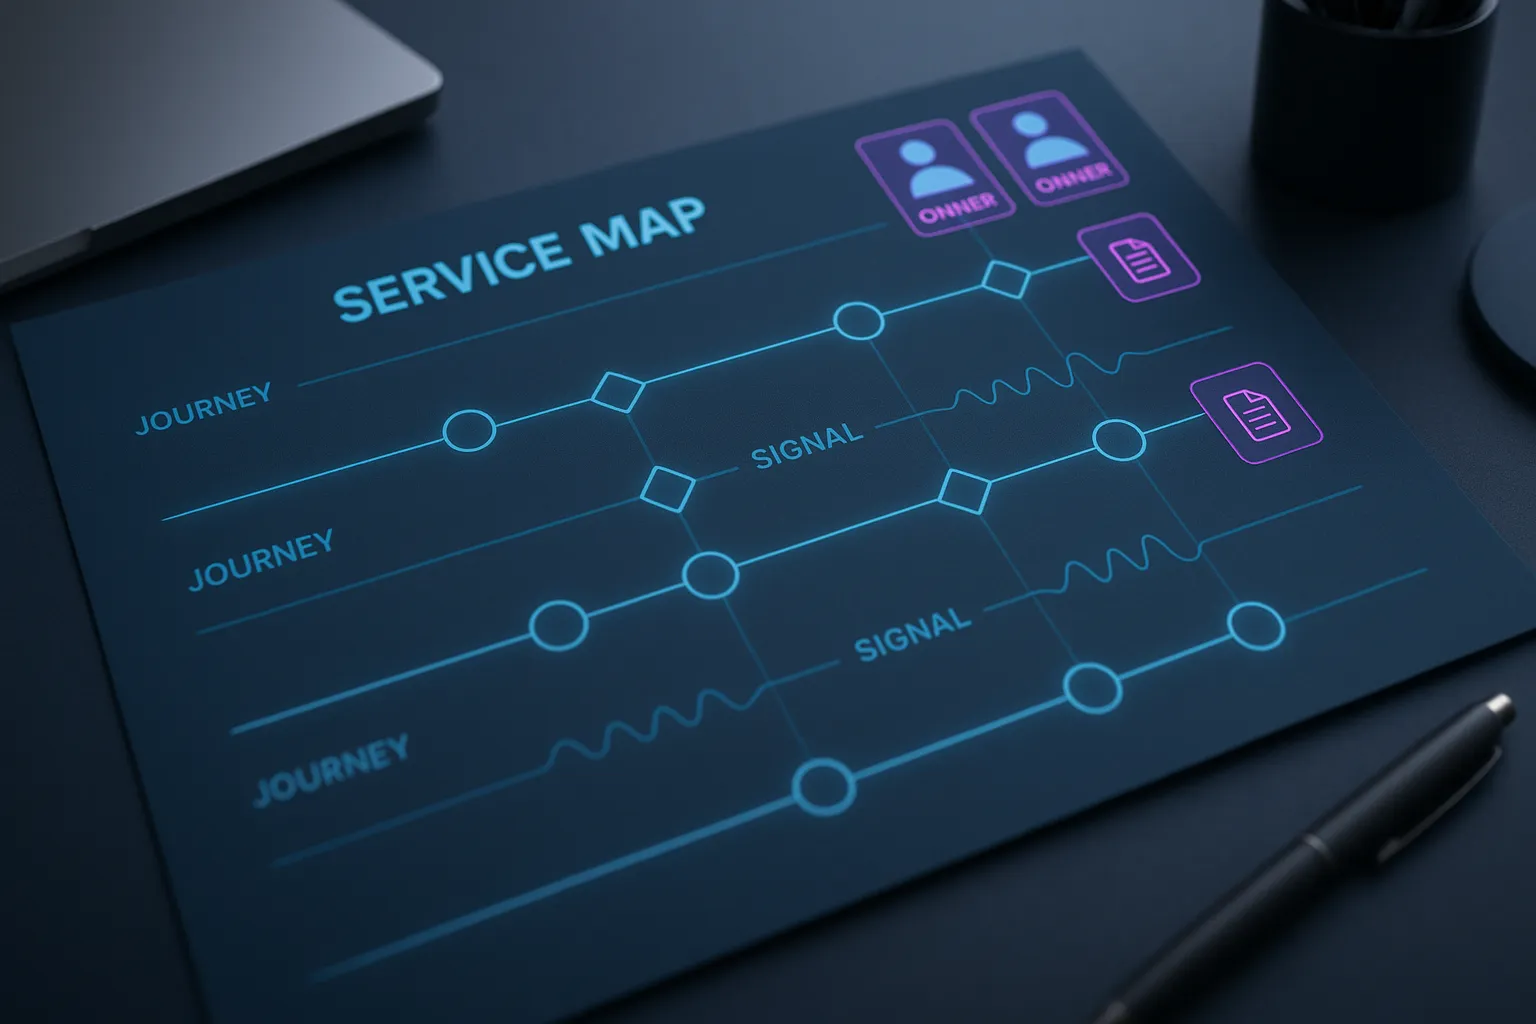
What a service map changes
A simple service map would have changed the first five minutes. It puts the business path on one page, with owners and signals that matter:
- Purpose and owner - “Checkout,” owned by a named product leader and a named engineering lead
- Key journeys - guest checkout, saved card checkout, alternative pay flows
- Business KPIs - orders per minute, checkout success rate, average order value
- Golden signals - payment authorization latency, error rate on key steps, saturation
- Dependencies - payments, tax, pricing, inventory, identity, email receipt
- Targets and runbooks - clear service targets and links to step-by-step fixes
With that map, the story runs differently. You open “Checkout” and see journey success sliding while payment and tax calls run hot. You can point to a specific dependency on the critical path, not a vague “the stack seems slow.” You can size the impact with simple math tied to the business service - starts × success × value × time - so leadership gets a number, not a shrug. Support gets a single sentence to share with customers that sets expectations without blame. Vendor management has the data to escalate with a clear clock and proof.
The deeper lesson is governance. If there is no service map, there is no clear owner of cross-system risk. The org fights the last incident, not the pattern. The pattern is consistent: vendor dependencies, peak-time behavior, and code changes that pass component tests but break the business path. A living map puts those truths in one place and makes them easy to review before the next peak.
Quick move
Pick one revenue-touching service. Name the owner pair. Draft Version 0.1 of the map with the six bullets above. Do not polish. Capture what is true today. Put it where leaders and responders can find it fast.
Map a business service without the noise
Key term: Service map - one page that links a business service to its journeys, dependencies, and signals
Most service maps fail because they try to capture everything. Version 0.1 should capture only what changes decisions. Aim for clear names, short lists, and owners people recognize.
The canvas
Pick one service that moves money and follow the canvas.
- Service and purpose - name the service in customer words and state why it exists
- Owners - one product lead and one engineering lead, both accountable
- Success definition - the exact moment the customer is successful (for example, order ID returned)
- Business KPIs - two or three numbers the business already tracks (orders per minute, checkout success rate, average order value)
- Critical journeys - the few paths that move revenue or trust (guest checkout, saved card checkout, alt pay)
- Dependencies - internal services and third parties on the critical path (payments, tax, pricing, inventory, identity, email)
- Signals and targets - the handful of measures that show health (p95 payment auth latency, step error rate, saturation) and the acceptable range
- Runbooks - links to the first safe actions for the top failure modes
- Review cadence - when the map gets rechecked and by whom
Keep each line short. If a field does not help someone act, cut it.
Resist the urge to model the entire estate. One great map beats ten stale ones.
Make it live
- Version stamp - add a tiny “Last verified” line with a date and the owner who checked it
- Trigger updates - update on any release that touches the critical path, any vendor change, and before known peaks
- Tidy by subtraction - if a field has not helped in the last review, remove it
- One ritual - a short monthly review with the owner pair and responders: what changed, what failed, what to simplify
Pitfalls to avoid
- Metric salad - too many signals hide the story; keep the few that move decisions
- Tool names - name the dependency by what it does for the customer, not the vendor product label
- Owner-by-committee - split accountability kills action; keep the owner pair tight
- Stale posters - a pretty diagram that never changes is worse than no map
Quick check
Open your draft and answer out loud: what is the success moment, who owns it, which two dependencies can break it, and where is the first runbook link. If any answer takes more than a sentence, refine the map until it reads like a decision, not documentation.
Find the critical path and hidden risk
Key term: Critical path - the shortest route from a user action to the business outcome you care about.
Not every box on a map is equal. Some move revenue. Some only move CPU. When you can see the few that decide money and trust, prioritization stops being guesswork.
Spot the chokepoints
Key term: Single point of failure (SPOF) - one dependency that can stop the journey on its own.
Walk the path from user action to success. Mark the steps where one miss halts the journey: payment authorization, identity, pricing, tax, inventory, email receipt. These nodes deserve names, owners, and rehearsed failovers. Vendors sit on this path too. Their status pages are not a control. Contracts do not keep you live.
Key terms:
- ISP - the internet service provider that carries traffic between users and your services.
- CSP - the cloud service provider that runs your compute, storage, or managed services.
External risk is rising. The outage mix shifted from about 5:1 ISP-to-CSP in 2023 to about 3:1 in 2024 - plan for that reality on the map and in drills.
When you name a chokepoint, write the failure in plain words and the proof you will see.
Example: payment gateway response time for the slowest 5% of requests increases - checkout completion rate drops.
Keep it this simple so teams move without translation.
Rank what to fix first
Key term: Criticality score - a simple 1 to 9 score that ranks where to act first
Use a short list, not a spreadsheet. For each node on the critical path, set three levers to High, Medium, or Low:
- Revenue impact - how much money moves if this fails
- Customer impact - how visible and frustrating it is
- Regulatory or brand risk - what happens if it fails at the wrong time
Turn levels into numbers (High 3, Medium 2, Low 1) and add them. A 7 to 9 is a top risk. It gets three things:
- a tested failover
- an owner on call
- service-level alerts tied to clear targets
Scores of 4 to 6 get a plan but not a rush. Scores of 3 or less get documented and reviewed later.
Ground inputs in evidence:
- recent incidents and near misses
- where you already see SLO burn
- change history on the node and neighbors
- vendor SLA terms that matter, and last year’s peak behavior
You are not chasing perfect accuracy - you are enforcing a consistent rule leaders can trust.
Make decisions fast
Turn the ranked list into three moves you can explain in one minute:
- Mitigate now - one reversible step that reduces exposure without waiting on root cause
- Fund next - the fix that removes one SPOF on the path
- Rehearse soon - the failover you will practice before the next peak
Put a named owner next to each move. Put the drill on the calendar to avoid the backlog explicitly. When the next blip hits, you will know who acts, what to try first, and which dependency to switch or fail over.
Quick move
Pick the critical path for one service. Score the top five nodes. Circle any at 7 or above. For each circled node, list one mitigation, one longer-term fix, and one drill. Publish the list where responders already work.
Business-SLO policy - error budgets with money
Key term: Error budget - the allowed amount of failure for a service within a time window before you must slow or stop change
A map without policy is a poster. Policy turns the map into fast, defensible decisions. You choose when to ship, pause, or freeze based on customer impact and money at risk, not gut feel.
Set targets that reflect customer tolerance
Key term: SLO (service level objective) - the reliability level customers should feel on a key journey
Pick 2 to 3 targets per critical journey in customer terms first. Examples: checkout completion rate, payment authorization response time for the slowest 5% of requests, sign-in success. Keep targets realistic now - raise them as you mature.
Pick guardrails that match your cadence
Key term: Burn rate - how fast the error budget is being consumed over time
Not every team ships daily. Choose the lightest guardrail that fits release pace:
-
Fast cadence - daily or more Track a short burn window for spikes and a longer one for slow leaks. Pair burn with the journey metric that moves money.
-
Moderate cadence - a few times per week Skip multiple windows. Watch weekly budget consumption vs a seasonal baseline. If consumption steepens or the journey metric falls, review changes and consider a pause.
-
Slow cadence - weekly or slower Use per-change checks. Before release, confirm SLOs and vendor health. After release, run a brief validation on the journey metric. If SLOs breach or the metric drops, roll back or pause further changes.
Simple gates everyone can follow
Use three plain gates so action is automatic:
-
Caution: Early strain - rising burn, a steeper weekly trend, or a visible drop in the journey metric. Action: raise visibility, review recent changes and vendor status, prep a safe lever.
-
Pause: Clear customer impact or revenue at risk crosses your threshold. Action: pause non-urgent releases on the affected service. Product and ops decide when to resume after stability returns.
-
Freeze: Repeated pauses in a short period or sustained impact. Action: change freeze on the service, switch to a tested failover if a dependency is at fault, and run first safe actions from the runbook.
Keep the gates next to the service map in plain language.
Wire policy into change
Integrate the gates with your pipeline. If the budget or trend is healthy, you ship. If a gate is active, the system prompts for a pause or blocks until recovery. Tag releases with the service they touch so owners see budget spend tied to changes. For vendor-heavy paths, add a pre-release check for provider status and your reroute plan.
Show the money without waiting for finance
Use a simple estimator: starts × completion rate × value per completion × time. When guardrails trigger and completion rate dips, you can size impact in near real time. Leaders get a number, not a guess.
Ownership and cadence
Name one business owner and one engineering owner. Run a short monthly review - are targets right, are gates tuned, which levers worked, which dependencies need rehearsal. Before peaks, recheck targets and thresholds and publish the gates where responders already work.
Closing thoughts
You drafted the map, named the owner pair, scored the top five nodes, and set Caution/Pause/Freeze gates wired to releases; you added a last-verified stamp, a simple impact estimator, and a drill on the calendar. Do this and see yourself moving toward fewer high-severity incidents, faster decisions, safer deploys, and protected revenue at peak.